Custom Dashboards
Goal: Create and view custom dashboard views with the metrics and charts most relevant to your work.
Custom Dashboards let you build personalized views of program data — beyond what the default Dashboard shows. They're especially useful for tracking grant-specific metrics and location comparisons.
Default vs. Custom Dashboards
The default Dashboard (under Getting Started) shows:
- My View, Location, and Program tabs
- Pre-configured widgets for attendance, enrollment, and activity
Custom Dashboards let you:
- Choose which metric cards to display (from 6 fixed metrics)
- Filter each metric by location
- Save and name dashboards for quick access
- Share dashboard configurations with other staff
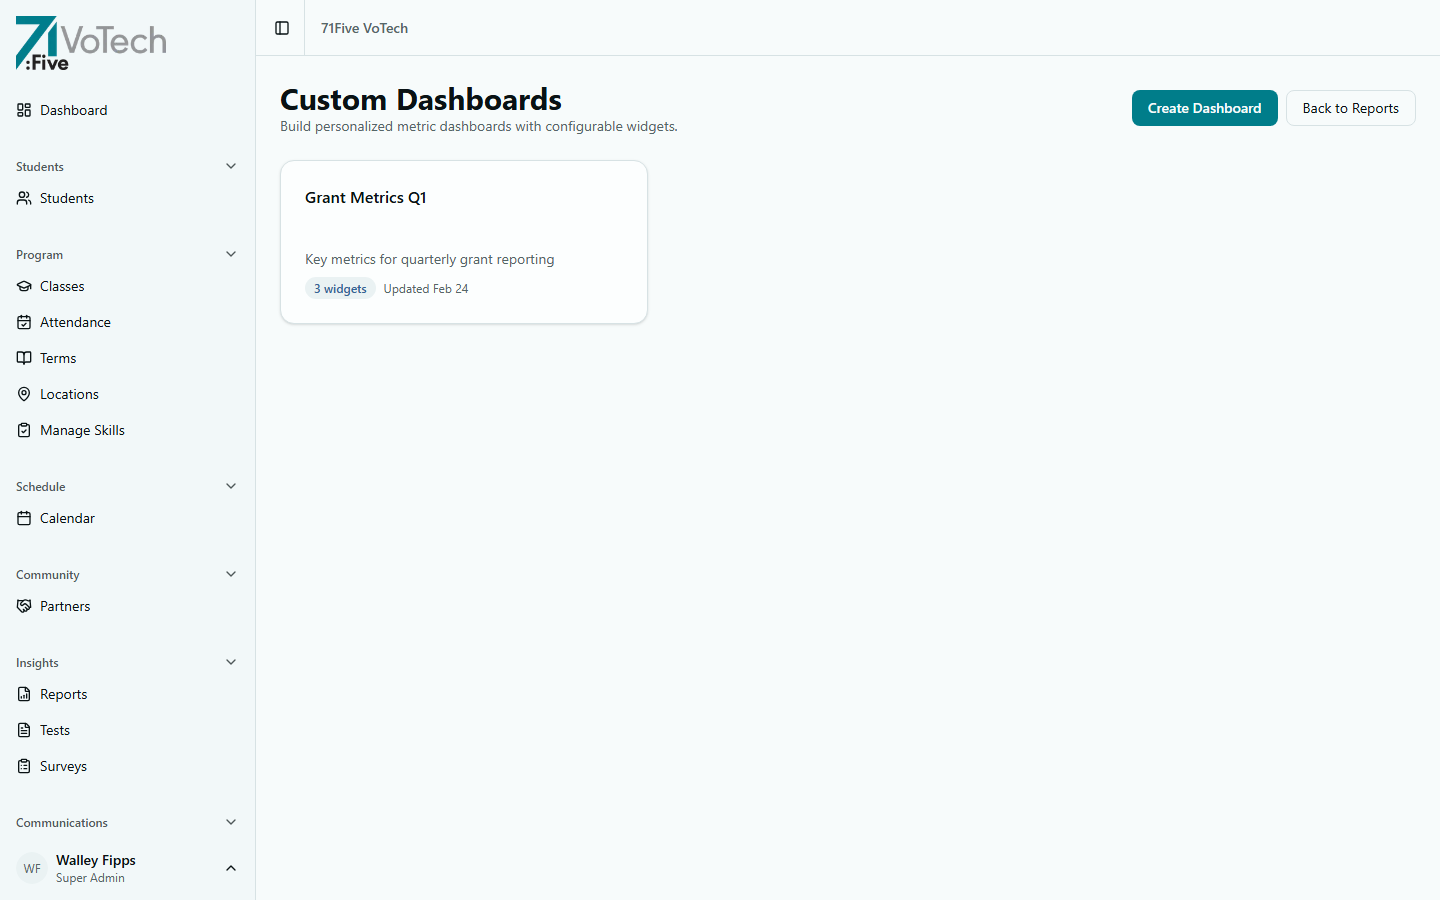
Creating a Custom Dashboard
- Click Reports in the sidebar, then select Dashboards (or access from the Dashboard page)
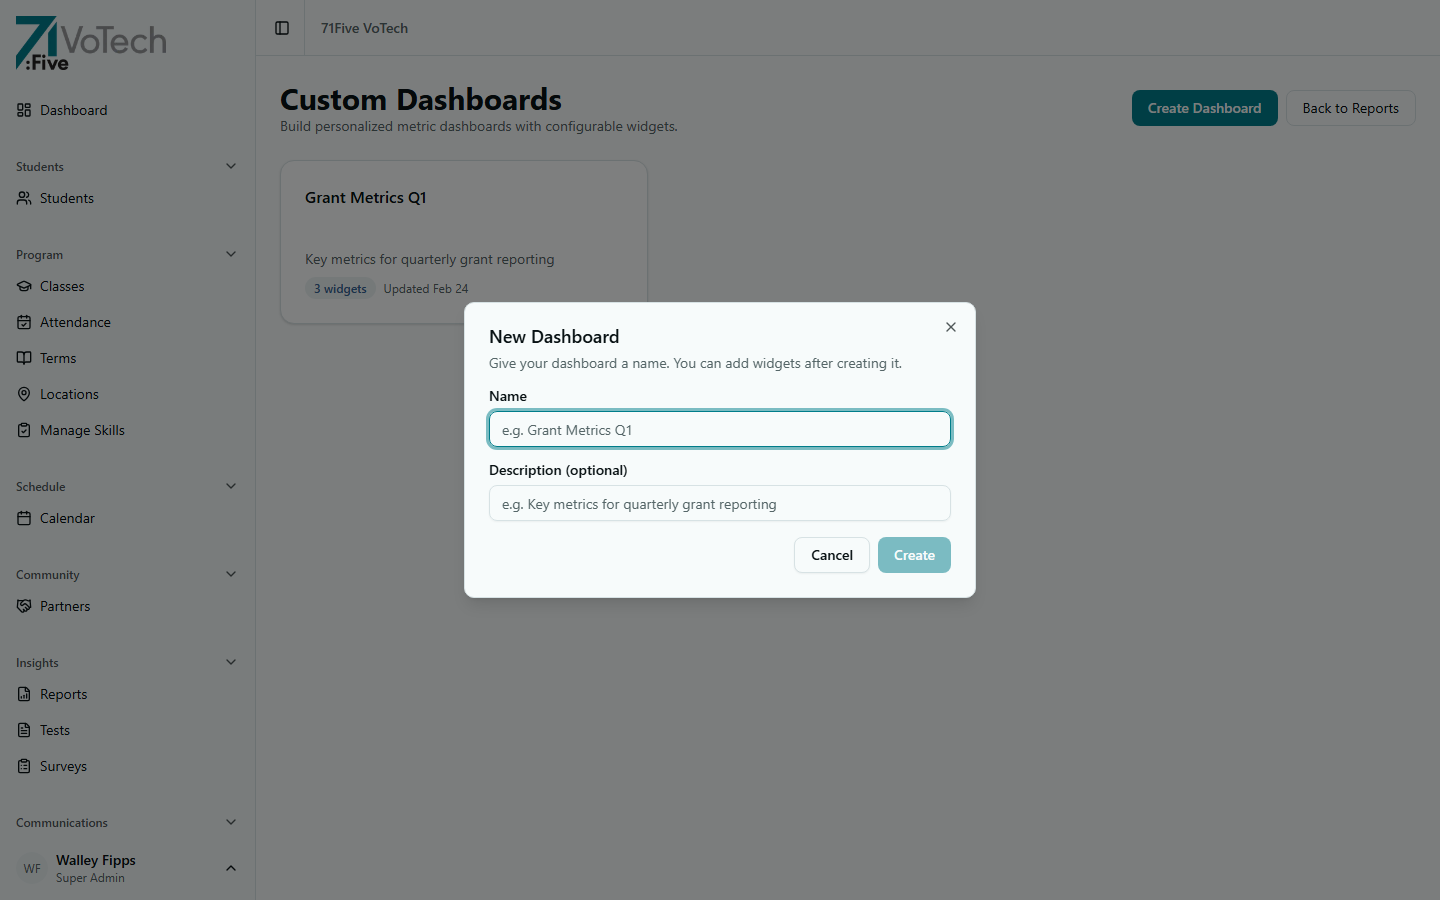
- Click Create Dashboard
- Name your dashboard (e.g., "BOLI Quarterly Metrics")
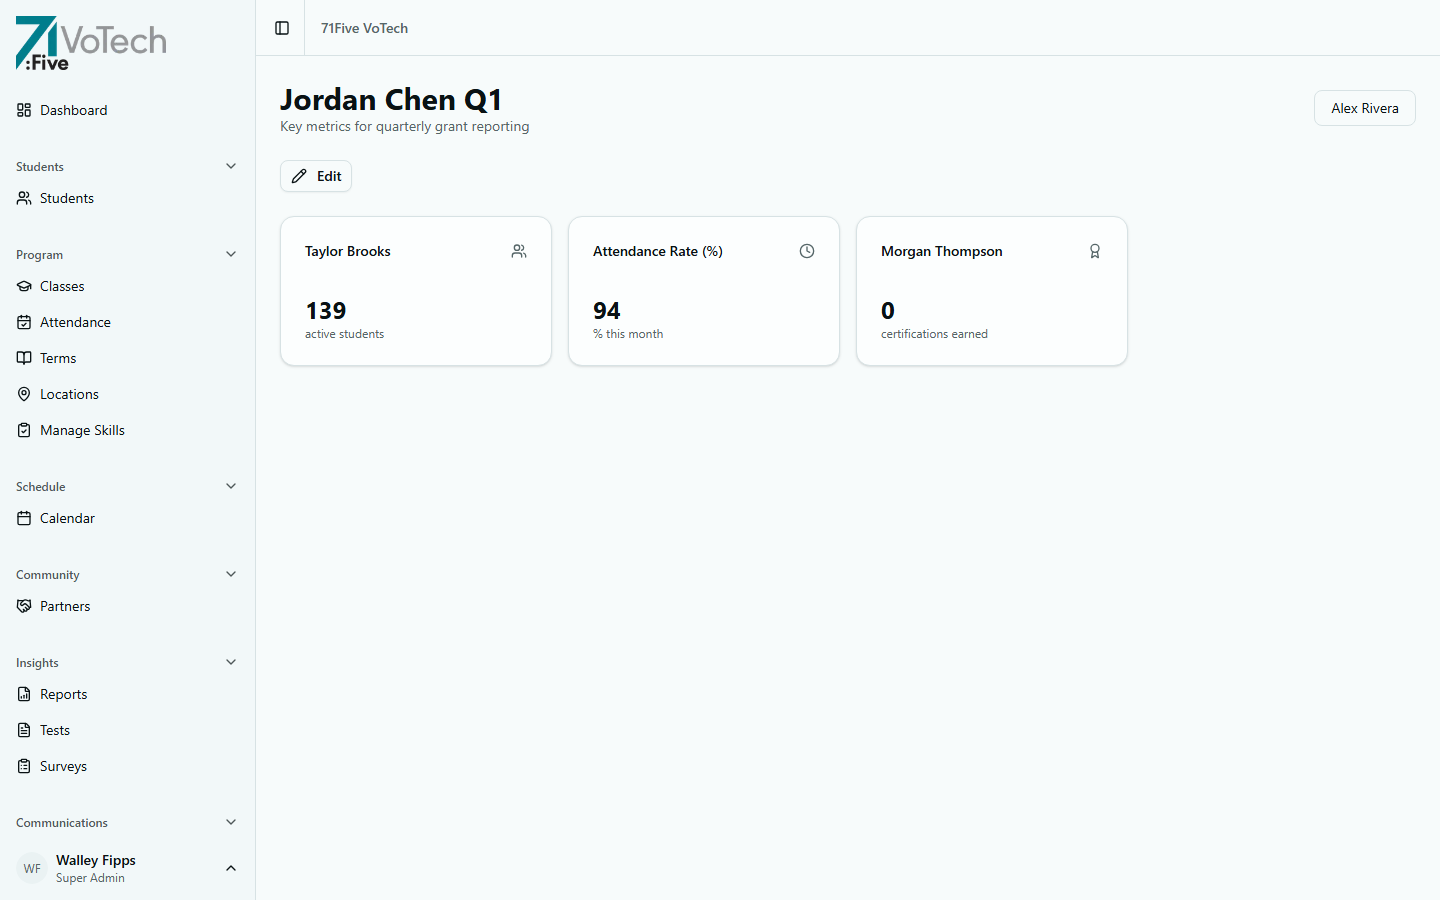
- Add metric card widgets from the 6 available metrics:
- Active Students — count of currently enrolled students
- Attendance Rate — percentage across selected location
- Avg Test Score — mean score across administered tests
- Certifications Earned — total certifications awarded
- Enrollments This Term — new enrollments in the active term
- Survey Satisfaction — average satisfaction rating from surveys
- Configure each widget with a location filter
- Click Save
Once configured, the dashboard detail page shows your widgets in a grid layout.
Example Dashboards
Grant Writer: BOLI Overview
- Active Students filtered to BOLI location
- Certifications Earned metric
- Enrollments This Term metric
Director: Location Comparison
- Active Students per location (one card per site)
- Attendance Rate per location
- Enrollments This Term per location
Outcomes Report Dashboard
Available to: Super Admin, Director, Case Manager, Grant Writer
The Outcomes Report at /dashboard/reports/outcomes provides a grant-reporting view of program results:
- Follow-up response rates (3/6/9/12 month)
- Employment outcomes
- Milestone completion
- Aggregate stats for grant submissions
Access it from Insights → Reports → Outcomes in the sidebar.
Follow-Up Tracking Dashboard
Available to: Super Admin, Director, Case Manager
The Follow-Up Tracking dashboard at /dashboard/follow-ups gives an at-a-glance view of post-program follow-ups:
- Status breakdown across 3/6/9/12-month follow-ups
- Sortable tables of due, overdue, and completed follow-ups
- Location filter
- CSV export for grant reporting
Access it from Insights → Follow-Ups in the sidebar. See also Follow-Up System.
Tips & Common Mistakes
Start with one of the pre-built report templates in the Report Builder, then convert the results into a dashboard widget. This ensures your dashboard matches your report numbers.
Custom dashboards follow the same data tier restrictions as reports. Grant Writers see Tier 3-4 data only. Directors see their county's data.
Related Guides
- Report Builder
- The Dashboard — default dashboard