Report Builder
Goal: Build custom reports by selecting columns, applying filters, and exporting data as CSV.
The Report Builder lets you pull exactly the data you need — from student demographics to attendance stats to program outcomes. It's the primary tool for grant reporting and program analysis.
📊 Building a Report
- 1
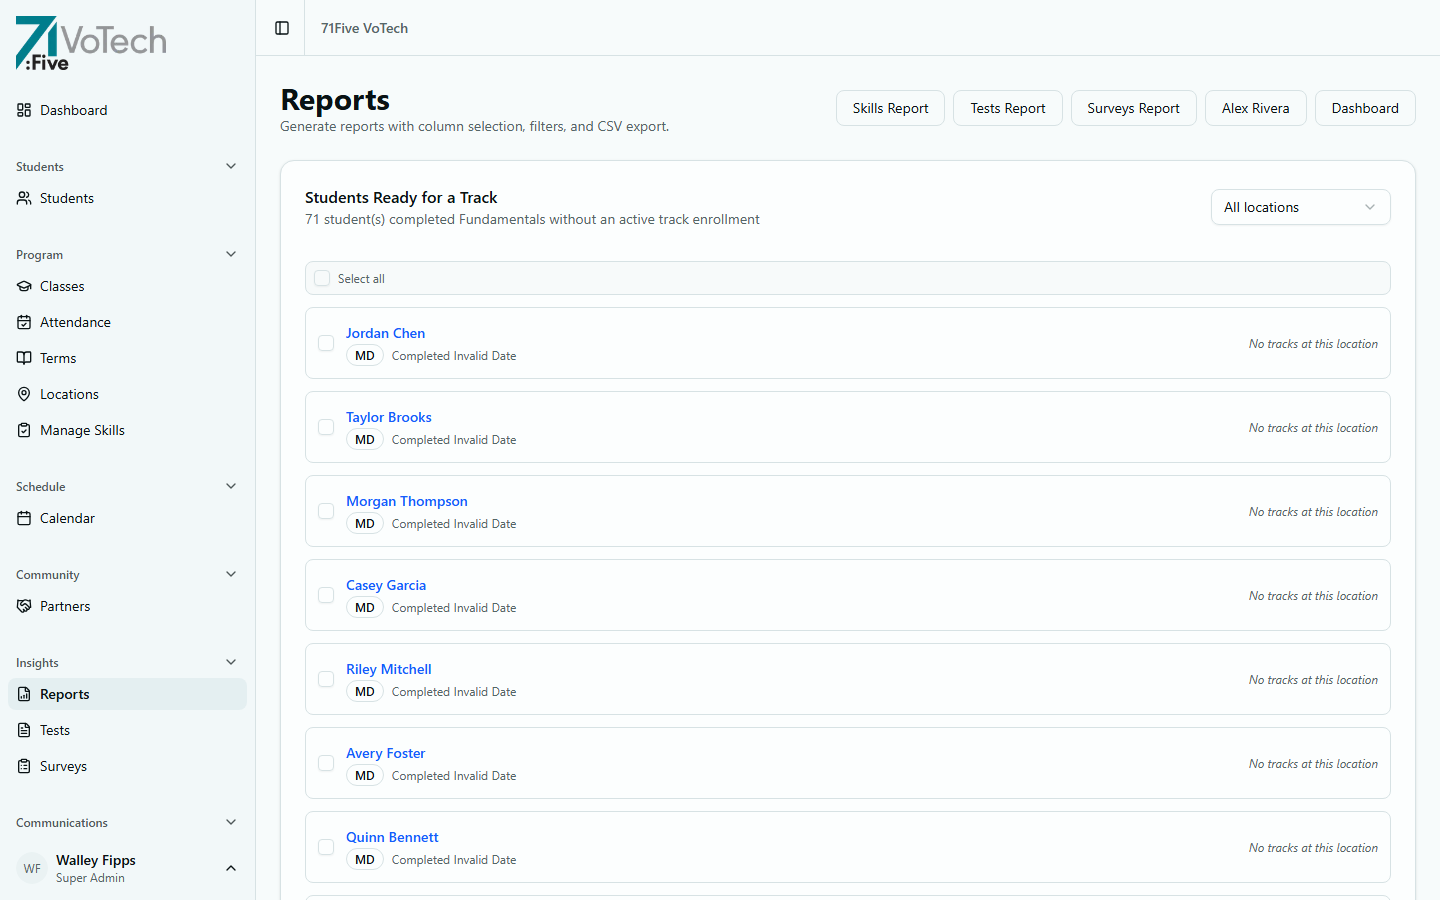
Open the Report Builder
Click Reports in the sidebar under Insights. The page shows quick presets, grant templates, and column selection.
- 2
Choose your columns
Check the boxes next to the data fields you want to include. Columns are organized into categories in a grid: Identity, Contact, Education, Program, Completion, Demographics, Employment, and Grants.
💡 Use a Quick Preset (Demographics, Attendance/Completion, or Grant Eligibility) to pre-select common column sets.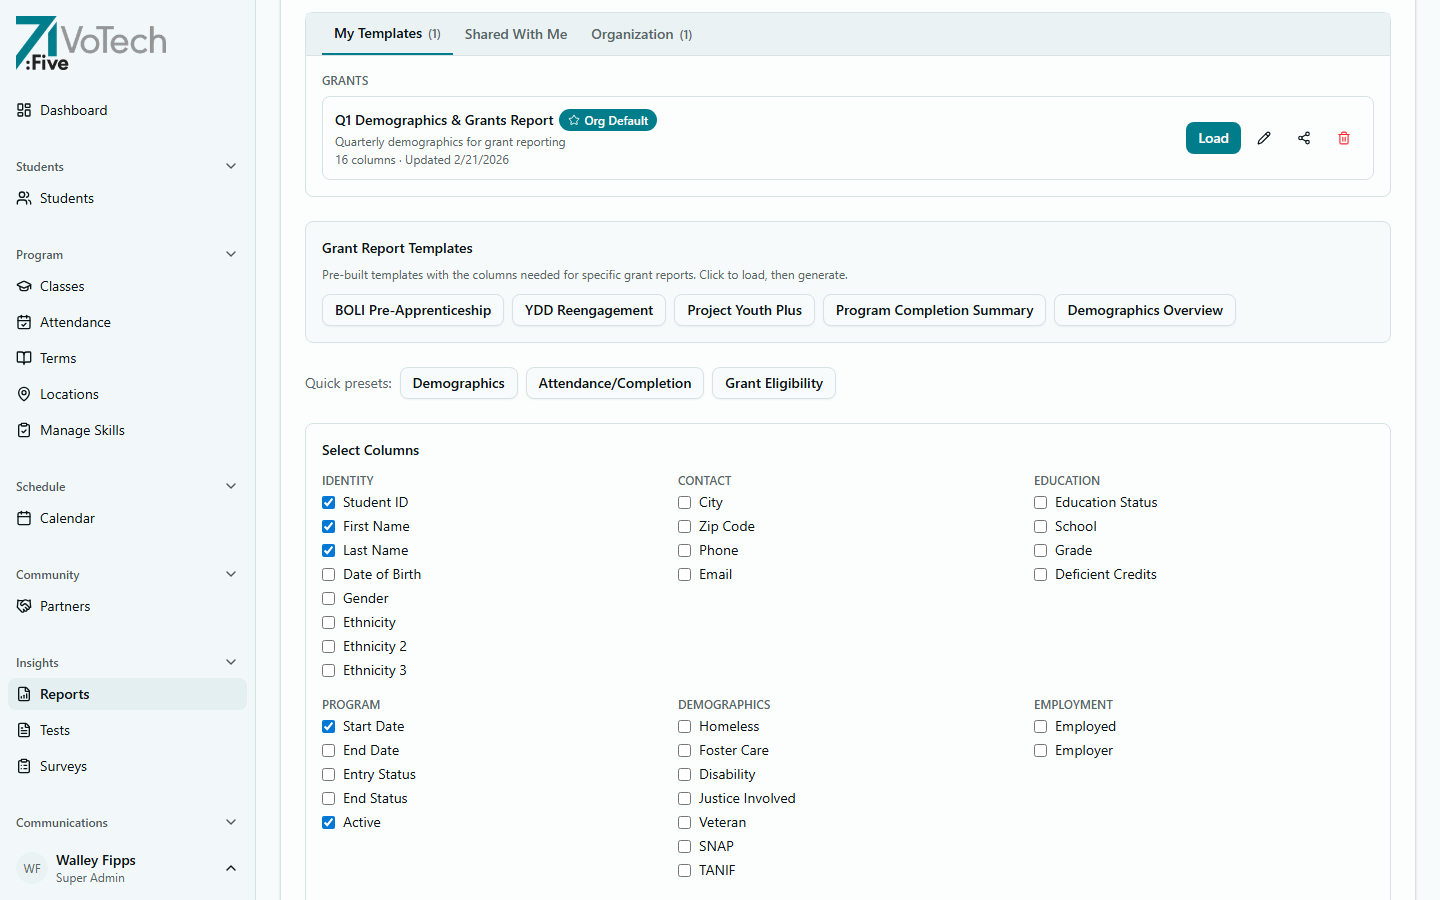
- 3
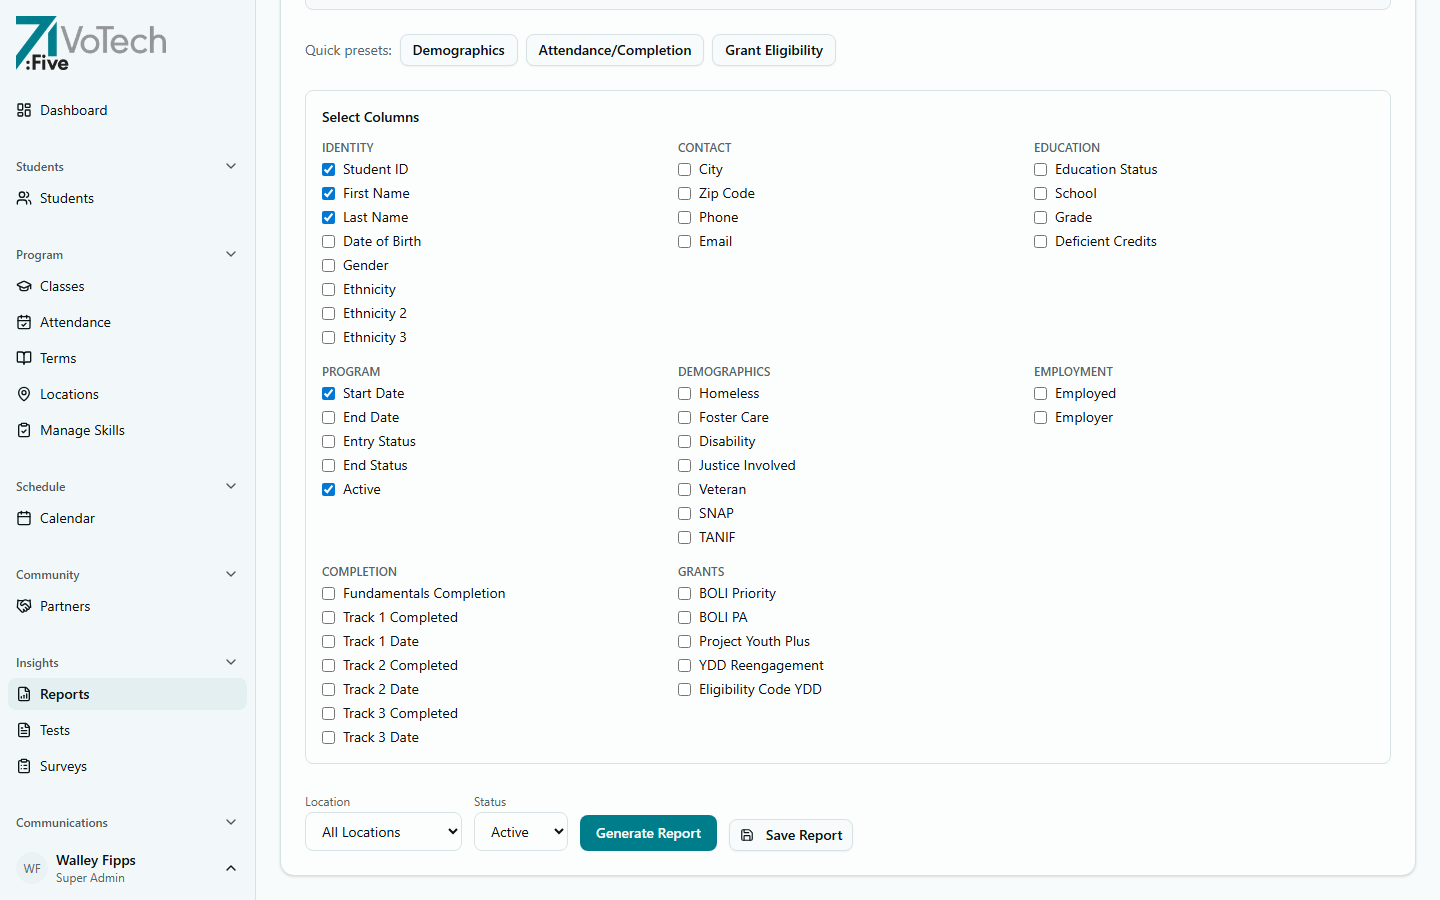
Filter your data
Use the Location dropdown to filter by site (All Locations, Medford, Grants Pass, Shady Cove) and the Status dropdown to filter by Active, Inactive, or All students.
- 4
Generate the report
Click Generate Report. The results table appears below with all matching records and your selected columns.
- 5
Export as CSV
Click Export CSV to download the full report. The file is named votech-report-YYYY-MM-DD.csv. Open it in Excel, Google Sheets, or any spreadsheet application.
📋 Column Categories
| Category | Example Columns |
|---|---|
| Identity | Student ID, name, DOB, gender, ethnicity |
| Contact | Phone, email, address |
| Education | Education status, school, grade level |
| Program | Start date, end date, entry status, end status, is_active |
| Completion | Fundamentals completion date, Track 1/2/3 completed flags and dates |
| Demographics | Living situation, foster care, disability, veteran status |
| Employment | Employment status, employer, pay |
| Grants | BOLI, YDD, project code, PRISM consent |
📁 Grant Reporting Templates
VoTech includes pre-built grant report templates that pre-select the right columns and filters:
| Template | What It Includes |
|---|---|
| BOLI Pre-Apprenticeship | Students with BOLI flag, demographics, enrollment dates, attendance |
| YDD Reengagement | YDD-flagged students, demographics, attendance rates, skill growth |
| Project Youth Plus | Project Youth Plus participants, demographics, program outcomes |
| Program Completion Summary | Certifications, employment outcomes, follow-up data |
| Demographics Overview | Aggregate demographic breakdown across all active students |
To use a template:
- Click a template name in the Grant Report Templates section
- The columns and filters pre-populate automatically
- Adjust as needed, then click Generate Report
⚡ Quick Presets
For common tasks, use a Quick Preset button to instantly select a set of columns:
- Demographics — core identity and demographic fields
- Attendance/Completion — program identity fields (student ID, names, start/end dates, is_active, education status)
- Grant Eligibility — all grant-relevant fields (BOLI, YDD, project codes)
💾 Saving Reports
If you have save permission:
- Build and generate your report
- Click Save Report
- Name it descriptively (e.g., "Q2 2026 BOLI Report")
- The saved report appears in the Saved Reports section at the top of the page
- Click any saved report to reload its columns and filters
🔒 Data Tier Restrictions for Grant Writers
Grant Writers can run reports but are restricted by data tiers. You cannot include these columns:
- Tier 1: SSN (Super Admin only)
- Tier 2: ACE scores, case notes (Case Manager + Super Admin only)
- Tier 3 (TIER3_KEYS): Justice involvement, disability, LGBTQ+, foster care — restricted in any category
- Demographics category: Not visible to Grant Writers
If a grant application requires data you can't access, work with a Case Manager or Super Admin to pull those specific fields.
Grant Writers can access:
- Identity, Education, Program, Completion, Employment, and Grants columns
- Aggregate statistics and counts
- All Tier 4 data (program info, attendance, certifications, employment)
💡 Tips & Common Mistakes
For recurring reports, save the configuration and reuse it. This ensures consistency across reporting periods — same columns, same filters, same format every time.
Before submitting a grant report, verify the numbers against the dashboard. If the report count doesn't match what you see on the Dashboard's Program tab, check your filters — a common mistake is forgetting to filter by the correct status or location.
Reports include only students you have access to. A Director's report covers their county. A Super Admin's covers everything. If numbers seem low, check your role's location scope.